Use ADPlus to troubleshoot hangs and crashes in our Delphi applications

It's again debugging time and in this post I'm going to put forward how to use ADPlus to troubleshoot hangs or crashes of our Delphi applications. As I'm sure you know, applications are getting more and more complicated using different libraries and third party tools and sometimes it is quite difficult to find out where the current problem is located. It has happened to me quite often that a tool or app blows app without reason, without a proper exception (even though all exception handling mechanisms are there) so the final user never gets any indication about what's wrong. With few simple steps from this article you will be able to set up ADPlus correctly, attach it to your running process and then create the crash dump for its further analysis. Let's start with debugging time!.
Installing Debugging tools for windows:
This is the Swiss knife for any good developer. Bring it always with you as it is really helpful. You can download the library from here. Just install it and save it to and USB to be portable. Then spend time using it, not only using ADPlus but also with Windbg, as it is crucial that you know about how to analyse the crash dump.

Setting up our Delphi Applications:
To be sure our Delphi app is correctly identified, we need to generate the map file and then use an external tool to convert all that information to symbols.

Edit in the project options to generate debug information and a detailed map file. Then using map2dbg we will transform the map file into debug symbols (.dbg files).
Once your project is correctly set up, build it and you will get the map file. Download the latest version of map2dbg v1.3 and copy map2dbg.exe where your project is located and run the following command line:
Converted 6882 symbols.
You will now see a .dbg file with all necessary information for ADPlus.
Setting up the Symbols:
Once again, if we run ADPlus without setting up the symbols, we will only see address of memory without descriptions:
Call stack below ---
*** ERROR: Module load completed but symbols could not be loaded for C:\testAdPlus\Project1.exe
 # ChildEBP RetAddr  Args to Child
WARNING: Stack unwind information not available. Following frames may be wrong.
00 0012f550 004832bd 01aba8c0 0045f20b 0012f700 Project1+0xb3295
01 0012f698 00487615 0012f91c 01aba8c0 0012f9a8 Project1+0x832bd
02 0012f6e4 0045eed1 01aba8c0 0012f91c 01aba8c0 Project1+0x87615
03 0012f710 00487768 00050980 0012f9a8 01acb650 Project1+0x5eed1
04 0012f86c 00487615 00000111 0012f91c 09010401 Project1+0x87768
05 0012f8b8 004a7c25 0012f9a8 00000111 01acb650 Project1+0x87615
06 0012f8e4 00486cb3 0012f8f8 00486ccb 0012f914 Project1+0xa7c25
07 0012f914 0043fd4a 00000111 00000980 00050980 Project1+0x86cb3
08 0012f92c 762cfd72 000209ae 00000111 00000980 Project1+0x3fd4a
Setting up _NT_SYMBOL_PATH environment variable:
Create a new general environment variable with the following name: _NT_SYMBOL_PATH and the following value:
symsrv*symsrv.dll*C:\Symbols*http://msdl.microsoft.com/download/symbols.
Where C:\Symbols is the path to your symbols. This is the same parameter set in WinDbg which I explained in my previous post (monitoring atom table part I).
Setting up ADPlus:
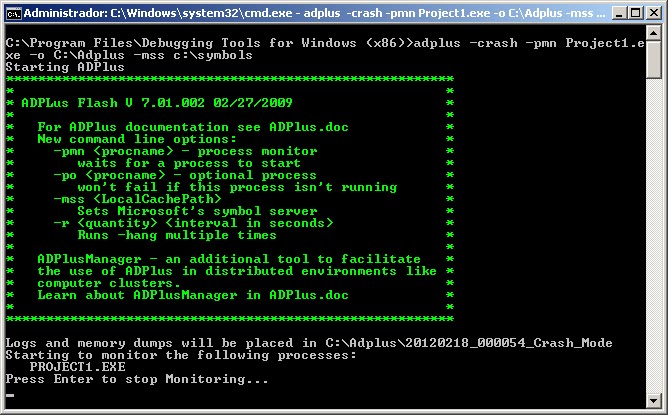
We can either run ADPlus using a simple configuration or use the configuration file which is much more complete. In any case, the fastest way is using the simple configuration which will help us to get the expected outcome.
C:\Program Files\Debugging Tools for Windows (x86)>adplus -crash -pmn Project1.exe -o C:\Adplus -mss c:\symbols
This configuration will run ADPlus looking for crashes, waiting for Project1.exe and it will output the results in C:\ADPlus and it will use the symbols from C:\Symbols.
This small piece of code will help me to generate a small access violation and then ADPlus will catch the crashing and it will generate the crash dump.
procedure TForm1.Button1Click(Sender: TObject);
begin
  try
    SimulateSystemException;
  finally
    Close;
  end;
end;

procedure TForm1.SimulateSystemException;
var
  p: PChar;
begin
  p := PChar(5);
  p^ := #9; //Access Violation here
end;
Once ADPlus is running, run your project, in my case Project1.exe and wait until it crashes (in my case it is just simulated so, the crash dump is instantly generated).
You will get a new line in the cmd window telling you:
Attaching to 4812 - Project1 in crash mode 02/18/2012 00:16:00
Once it crashes, go to C:\ADPlus folder and you will get a new folder with current date and the crash dump in it.

Analysing crash dump with Windbg:
Just open Windbg, load the first crash dump (FirstChance_Process_Shut_Down) and use the following commands:
0:000> !sym noisy
noisy mode - symbol prompts on
0:000> .reload Project1.exe
0:000> !analyze -v
ERROR: FindPlugIns 8007007b
*******************************************************************************
*                                                                             *
*                        Exception Analysis                                   *
*                                                                             *
*******************************************************************************

DBGHELP: kernel32 - public symbols  c:\symbols\kernel32.pdb\FCCF6FAC09804D49A4BB256A77F519572\kernel32.pdb
DBGHELP: Project1.exe is stripped.  Searching for dbg file
SYMSRV:  c:\symbols\Project1.dbg\4F3D9543457000\Project1.dbg not found
SYMSRV:  http://msdl.microsoft.com/download/symbols/Project1.dbg/4F3D9543457000/Project1.dbg not found
DBGHELP: .\Project1.dbg - file not found
DBGHELP: .\exe\Project1.dbg - path not found
DBGHELP: .\symbols\exe\Project1.dbg - path not found
DBGHELP: Project1.exe missing debug info.  Searching for pdb anyway
DBGHELP: Can't use symbol server for Project1.pdb - no header information available
DBGHELP: Project1.pdb - file not found
*** WARNING: Unable to verify checksum for Project1.exe
*** ERROR: Module load completed but symbols could not be loaded for Project1.exe
DBGHELP: Project1 - no symbols loaded
DBGHELP: user32 - public symbols c:\symbols\user32.pdb\CFD2C4C8EB9C406D8B6DC29512EB176A2\user32.pdb
DBGHELP: ole32 - public symbols c:\symbols\ole32.pdb\EDE30219D57144FAAC83675A6573D1982\ole32.pdb
Once processed, we can actually spot that the symbols are missing. This is because we need to place the symbols at the location defined by Windbg -> c:\symbols\Project1.dbg\4F3D9543457000\Project1.dbg. Just copy your dbg file into defined location and try again reloading Project1.exe from Windbg command line.
Now we can analyse again the crash dump and get all the information needed about the crash. This time with the correct symbols:
Call stack below ---
*** WARNING: Unable to verify checksum for C:\Users\jordi coll\Desktop\testAdPlus\Project1.exe
 # ChildEBP RetAddr  Args to Child
00 0012f550 00473c9d 008fa8c0 00455747 0012f700 Project1!Unit1.TForm1.SimulateSystemException+0x5
01 0012f698 00477ff5 0012f91c 008fa8c0 0012f9a8 Project1!Controls.TControl.Click+0x75
02 0012f6e4 0045540d 008fa8c0 0012f91c 008fa8c0 Project1!Controls.TWinControl.WndProc+0x56d
03 0012f710 00478148 00010d2e 0012f9a8 0090b650 Project1!StdCtrls.TButtonControl.WndProc+0x71
04 0012f86c 00477ff5 00000111 0012f91c 09010401 Project1!Controls.DoControlMsg+0x28
05 0012f8b8 004984b1 0012f9a8 00000111 0090b650 Project1!Controls.TWinControl.WndProc+0x56d
06 0012f8e4 00477693 0012f8f8 004776ab 0012f914 Project1!Forms.TCustomForm.WndProc+0x599
07 0012f914 0043c146 00000111 00000d2e 00010d2e Project1!Controls.TWinControl.MainWndProc+0x2f
08 0012f92c 762cfd72 00010d26 00000111 00000d2e Project1!Classes.StdWndProc+0x16
09 0012f958 762cfe4a 00380fc8 00010d26 00000111 USER32!InternalCallWinProc+0x23
0a 0012f9d0 762d0943 00000000 00380fc8 00010d26 USER32!UserCallWinProcCheckWow+0x14b (FPO: [Non-Fpo])
0b 0012fa10 762d0b36 00fd2450 00fd23e8 00000d2e USER32!SendMessageWorker+0x4b7 (FPO: [Non-Fpo])
0c 0012fa30 74d1b4ba 00010d26 00000111 00000d2e USER32!SendMessageW+0x7c (FPO: [Non-Fpo])
0d 0012fa50 74d1b51c 00a54518 00000000 00080032 comctl32!Button_NotifyParent+0x3d (FPO: [Non-Fpo])
0e 0012fa6c 74d1b627 54010001 00000001 0012fb48 comctl32!Button_ReleaseCapture+0x112 (FPO: [Non-Fpo])
0f 0012facc 762cfd72 00010d2e 00000202 00000000 comctl32!Button_WndProc+0xa98 (FPO: [Non-Fpo])
10 0012faf8 762cfe4a 74cb70f8 00010d2e 00000202 USER32!InternalCallWinProc+0x23
11 0012fb70 762d09d3 00000000 74cb70f8 00010d2e USER32!UserCallWinProcCheckWow+0x14b (FPO: [Non-Fpo])
12 0012fba0 762d0979 74cb70f8 00010d2e 00000202 USER32!CallWindowProcAorW+0x97 (FPO: [Non-Fpo])
13 0012fbc0 004780f5 74cb70f8 00010d2e 00000202 USER32!CallWindowProcW+0x1b (FPO: [Non-Fpo])
14 0012fd44 00477ff5 00000202 008fa8c0 0012fd80 Project1!Controls.TWinControl.DefaultHandler+0xdd
15 0012fd90 0045540d 0012fe64 00000202 008fa8c0 Project1!Controls.TWinControl.WndProc+0x56d
16 0012fdd0 0043c146 00000202 00000000 00080032 Project1!StdCtrls.TButtonControl.WndProc+0x71
17 0012fde8 762cfd72 00010d2e 00000202 00000000 Project1!Classes.StdWndProc+0x16
18 0012fe14 762cfe4a 00380fbb 00010d2e 00000202 USER32!InternalCallWinProc+0x23
19 0012fe8c 762d018d 00000000 00380fbb 00010d2e USER32!UserCallWinProcCheckWow+0x14b (FPO: [Non-Fpo])
1a 0012fef0 762d022b 00380fbb 00000000 00010d2e USER32!DispatchMessageWorker+0x322 (FPO: [Non-Fpo])
1b 0012ff00 004a15d2 0012ff24 00010001 0012ff70 USER32!DispatchMessageW+0xf (FPO: [Non-Fpo])
1c 0012ff1c 004a1617 00010d2e 00000202 00000000 Project1!Forms.TApplication.ProcessMessage+0x122
1d 0012ff40 004a1942 0012ff54 004a194c 0012ff70 Project1!Forms.TApplication.HandleMessage+0xf
1e 0012ff70 004a9c96 0012ffc4 00405a14 0012ff88 Project1!Forms.TApplication.Run+0xce
1f 0012ff88 7610d0e9 7ffdd000 0012ffd4 77711603 Project1!Project1.Project1+0x4e
20 0012ff94 77711603 7ffdd000 7736d39e 00000000 kernel32!BaseThreadInitThunk+0xe (FPO: [Non-Fpo])
21 0012ffd4 777115d6 004a9c48 7ffdd000 00000000 ntdll!__RtlUserThreadStart+0x23 (FPO: [Non-Fpo])
22 0012ffec 00000000 004a9c48 7ffdd000 00000000 ntdll!_RtlUserThreadStart+0x1b (FPO: [Non-Fpo])

0:000> kvn
 # ChildEBP RetAddr  Args to Child
00 0012ff30 774a5370 7747b148 ffffffff 00000000 ntdll!KiFastSystemCallRet (FPO: [0,0,0])
01 0012ff34 7747b148 ffffffff 00000000 0012ff58 ntdll!ZwTerminateProcess+0xc (FPO: [2,0,0])
02 0012ff44 76f241ec 00000000 77e8f3b0 ffffffff ntdll!RtlExitUserProcess+0x7a (FPO: [Non-Fpo])
03 0012ff58 00405f73 00000000 0012ff88 00000000 kernel32!ExitProcess+0x12 (FPO: [1,0,0])
04 0012ff70 004a9c9b 0012ffc4 00405a14 0012ff88 Project1!System.Halt0+0xf3
05 0012ff88 76f2d0e9 7ffd3000 0012ffd4 77481603 Project1!Project1.Project1+0x53
06 0012ff94 77481603 7ffd3000 77aa9471 00000000 kernel32!BaseThreadInitThunk+0xe (FPO: [Non-Fpo])
07 0012ffd4 774815d6 004a9c48 7ffd3000 00000000 ntdll!__RtlUserThreadStart+0x23 (FPO: [Non-Fpo])
08 0012ffec 00000000 004a9c48 7ffd3000 00000000 ntdll!_RtlUserThreadStart+0x1b (FPO: [Non-Fpo])
The only remaining thing is to analyse the crash dump trying to identify which are the regions involved in the crash and tackle them!.
Happy ninja debugging!.
Related links:


Comments
Post a Comment